MTT variance: how big tournament swings really are
Tournament results swing far harder than cash results, and the maths says by how much. Under a stated payout model, one tournament in a 1,000-runner field has a standard deviation of about 7.8 buy-ins for a 20% ROI player, which is why a real edge can take thousands of events to show.

What MTT variance actually measures
In a cash game you measure swings in big blinds per hour. In a tournament the natural unit is the buy-in. Each event is one draw from a very lopsided distribution: most of the time you lose exactly one buy-in, some of the time you min-cash, and rarely you finish near the top and win many times your entry. The standard deviation per tournament, in buy-ins, is the number that captures how wide that distribution is.
Two features make tournament variance different from cash variance. First, the downside of a single event is capped at one buy-in, ignoring re-entries. Second, the upside is huge and rare. The average is dragged up by results you will seldom see, so the typical tournament loses money even for a strong winner. That shape is why a winning MTT player can spend months below break-even without anything being wrong with their game.
The practical consequence is that your ROI is a very noisy estimate. A cash player with a few hundred hours has a weak read on their win rate. A tournament player with a few hundred events often has almost no read at all, and the numbers below show why.
The model behind every number on this page
Real payout tables differ by site, series and field size, so this page uses one stated model and shows its workings instead of quoting a rule of thumb. The field pays the top 15% of entrants. The prize pool equals the entries, so the entry fee is left out and a player with no edge breaks even. Each paid place gets a share proportional to one over its finishing position, the curve known as Zipf's law. In a 1,000-runner field that gives first place about 179 buy-ins and the last paid place about 1.19 buy-ins.
Skill enters as a single multiplier. A player with a 20% ROI is 20% more likely than an average entrant to finish in every paid place, so their cash rate rises from 15% to 18%. That is a simplification: real winners convert more often at final tables than at the bubble. Treat the outputs as honest orders of magnitude for this model, not as a forecast for your own schedule.
The model also leaves out bounties, re-entry pressure and satellites. Each of those changes the shape of the distribution. Where your own records exist, the formulas in the last section let you replace the model with your real numbers.
Standard deviation by field size
Bigger fields mean bigger top prizes and a longer tail of losing events, so the standard deviation per tournament climbs with the field. Under the model, going from a 100-runner field to a 1,000-runner field roughly doubles the standard deviation, and a 2,000-runner field adds more again. An edge makes the spread slightly wider, not narrower, because a winner reaches the big prizes more often.
Read the table as the size of one tournament's swing. A standard deviation of 7.8 buy-ins against an average gain of a fifth of a buy-in means the noise in a single event is dozens of times larger than the edge. Only volume shrinks that ratio, and it shrinks slowly.
How many tournaments before an ROI means something
The 95% band around a measured ROI is the ROI plus or minus 1.96 standard deviations divided by the square root of the number of tournaments. Hold the true ROI at 20% in a 1,000-runner field and watch what volume buys. After 100 tournaments the band is so wide that it cannot tell a strong winner from a heavy loser. After 1,000 tournaments it still runs from -29% to 69%.
The point where the bottom of the band clears zero is where the square root of the tournament count exceeds 1.96 times the standard deviation divided by the ROI. For a 20% ROI in a 1,000-runner field that is about 5,900 tournaments. A 10% ROI needs about 21,700, and a 40% ROI about 1,700. Smaller fields prove an edge faster: at a 20% ROI the same test needs about 1,500 tournaments in a 100-runner field and 3,800 in a 500-runner field.
This is the arithmetic behind the common warning that a 2,000-tournament sample is small. It is not pessimism. For large fields it is simply what the square root does.
Why the graph stays flat for months
Most of the money in a tournament sits at the final table. Under the model, the top nine places in a 1,000-runner field share 51% of the prize pool, and in a 100-runner field they share 85%. A 20% ROI player reaches the final nine of a 1,000-runner field only about 1.1% of the time.
That has a direct cost in patience. The chance of playing 100 of those tournaments without a single final-table finish is about 34%. Over 300 tournaments it is still about 4%. Cashes are more frequent but small, and any particular block of 10 tournaments has about a 14% chance of containing no cash at all.
So a long flat or falling stretch is the normal state of a winning tournament graph, broken by a few deep runs that carry the whole result. When you review a bad month, check decisions and fatigue first. The graph on its own cannot separate a leak from the absence of a deep run.
Bankroll: the cash formula overstates it, but not by enough to relax
The bankroll formula used for cash games, bankroll equals minus the standard deviation squared times the natural log of the target risk, divided by twice the win rate, assumes results are roughly normal. Tournament results are not. Losses are capped at one buy-in while the wins are rare and large, and that shape makes the true risk of ruin lower than the normal formula says.
Ruin theory gives a cleaner answer. For independent results with a positive average, Lundberg's inequality bounds the chance of ever losing B buy-ins by e to the power of minus gamma times B, where gamma is the adjustment coefficient: the positive number that makes the average of e to the power of minus gamma times the result equal to one. Solving that equation for the model gives the last column of the table below. Because a tournament can lose at most one buy-in, the bound is tight to within about one buy-in.
For a 20% ROI in a 1,000-runner field, holding the chance of ever losing the whole roll to 5% takes about 330 buy-ins under the exact model, against 460 from the cash formula. Cutting the risk to 1% raises it to about 500. BBZ Poker describes 100 to 200 buy-ins as a starting point, not a ceiling, for large-field tournaments, and the model agrees that the floor is high. It assumes you never move down, so a written move-down rule, taken early, is what makes a smaller roll workable.
Work out your own MTT variance
You do not need the model if you have records. From your own tournament log, work out the net result of each event in buy-ins: cash minus total cost, divided by the buy-in, counting every re-entry and fee. Your ROI is the average of those results and your standard deviation is their spread. Mixed buy-ins work too if every result is expressed in buy-ins of its own event.
Then run the same two sums. Say you have 400 tournaments at a measured 15% ROI with a standard deviation of 7 buy-ins. The square root of 400 is 20. The band half-width is 1.96 times 7, which is 13.72, divided by 20, which is 0.686 buy-ins, or 69 ROI points. Your true ROI plausibly sits anywhere from about -54% to 84%. To clear zero at that ROI you would need 13.72 divided by 0.15, squared, which comes to about 8,400 tournaments.
Use the bottom of the band, not the headline, when you size a bankroll or plan a move up. The ROI calculator and the risk of ruin calculator on this site take the same inputs, and the poker variance guide covers the cash-game version of the same maths.
Keep the record complete, and keep it in proportion
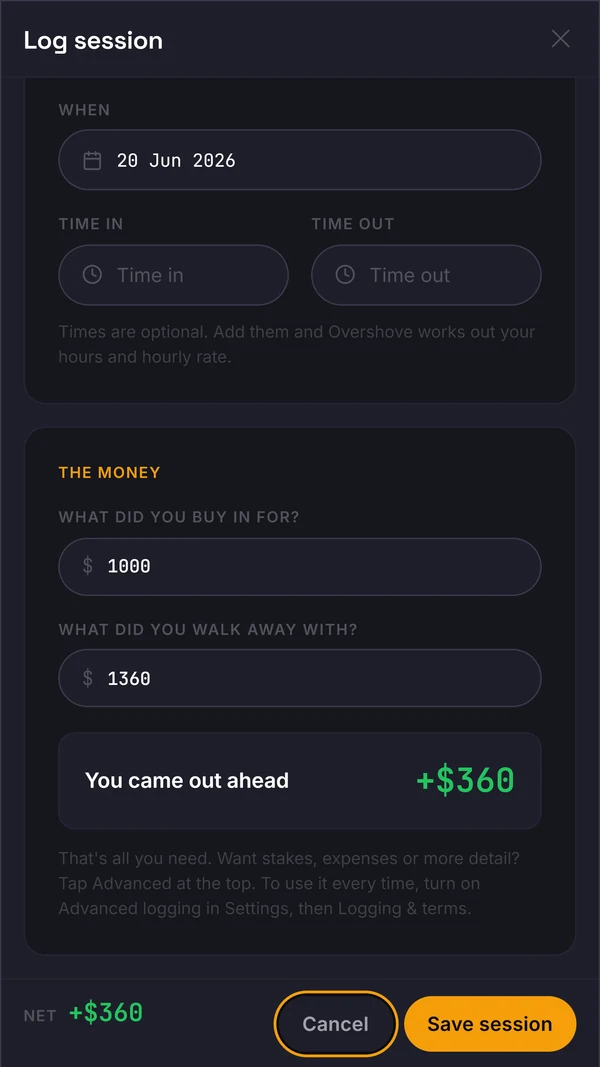
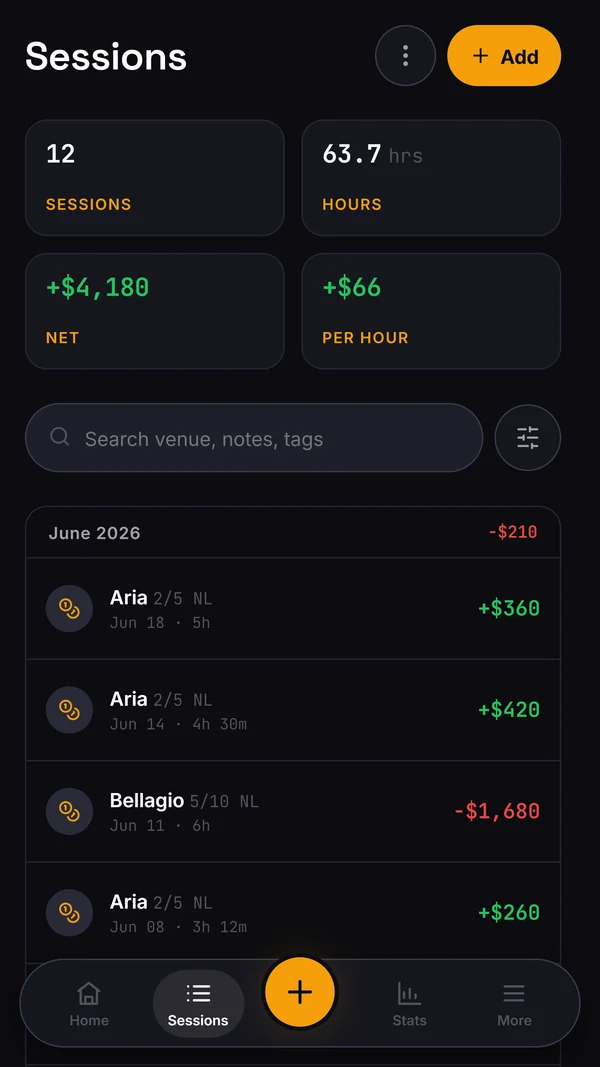
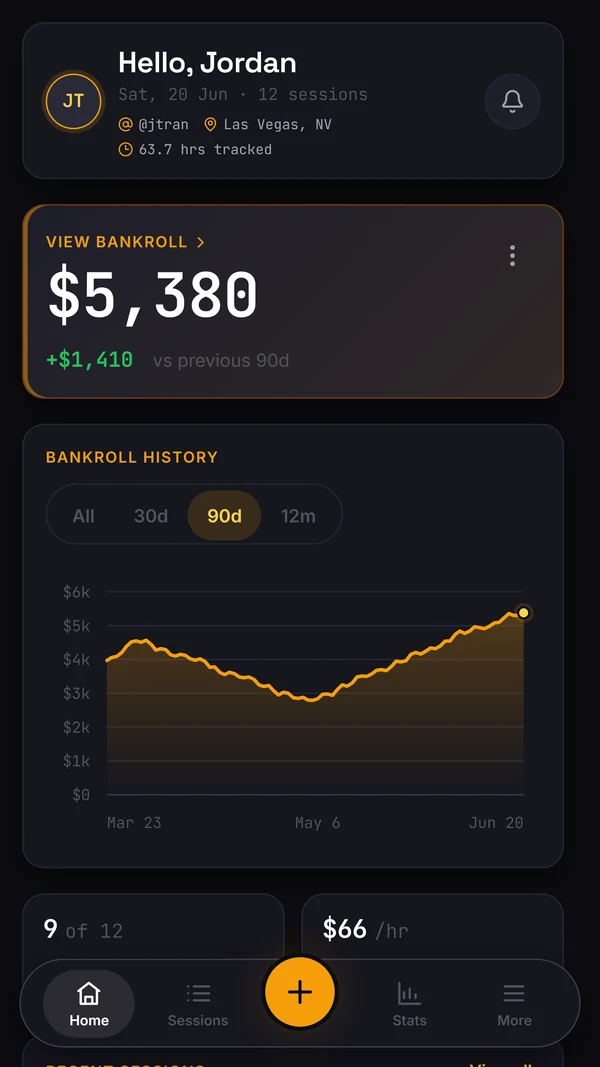
None of this works on a partial record. Re-entries, fees and the events you would rather forget change both the ROI and the standard deviation, and missing losers inflate both. Log every entry at the time you make it. Overshove's free core logs tournaments alongside cash sessions, including buy-in, rebuys and cash, so the numbers above can come from a full history. A variance and confidence read inside the app is coming soon; until then the formulas on this page work on your own logged totals.
Tournament poker is an adult pastime with real financial risk. No ROI is guaranteed, and a model edge is not a salary. Play only with money set aside as a bankroll, never with money meant for bills, and step away if chasing a deep run starts to drive your decisions. The responsible play page lists free, confidential support in the UK and US.
Sources
Sources checked on 2026-09-27. The figures on this page come from the stated model and formulas.
- →One tournament in a 1,000-runner field has an SD of about 7.8 buy-ins under the model.
- →A 20% ROI in that field takes about 5,900 tournaments to clear zero at 95%.
- →The top nine places hold about half the prize money in a 1,000-runner field.
- →Size the roll from the bottom of your ROI band and write the move-down rule first.

Questions
What is a normal standard deviation for MTTs?
It depends mainly on field size and payout shape. Under this page's model it runs from about 4.0 buy-ins per tournament in a 100-runner field to about 9.9 in a 2,000-runner field for a 20% ROI player. Measure your own from your results once you have a few hundred events.
How many tournaments do I need to know my ROI?
For a 20% ROI in 1,000-runner fields, about 5,900 tournaments before the 95% band clears zero under the model. Smaller fields and bigger edges need fewer; thin edges in huge fields need far more.
Why does the cash bankroll formula give a bigger number for tournaments?
It treats results as normal. Tournament losses are capped at one buy-in and wins are rare and large, which lowers the true risk of ruin. The exact Lundberg bound for the model is smaller, though still about 330 buy-ins for a 20% ROI in 1,000-runner fields at a 5% risk.
Does this page work as an MTT variance calculator?
The tables are pre-computed for common field sizes, and the last section shows the two formulas to run on your own figures: 1.96 times your standard deviation divided by the square root of your tournament count for the band, and that same product divided by your ROI, squared, for the tournaments needed to clear zero.
Do bounties and re-entries change the numbers?
Yes. Bounties move money away from the final table and usually lower the spread; re-entries raise the cost of each event and the size of the swings. The model leaves both out, which is another reason to measure your own standard deviation.