Poker downswings, stop-loss rules and recovery
A downswing is a normal statistical event that can still damage decision quality. The right response combines realistic depth and duration maths with rules that protect the bankroll and stop fatigue or tilt from making the swing worse.

What Tom reviews beyond the graph
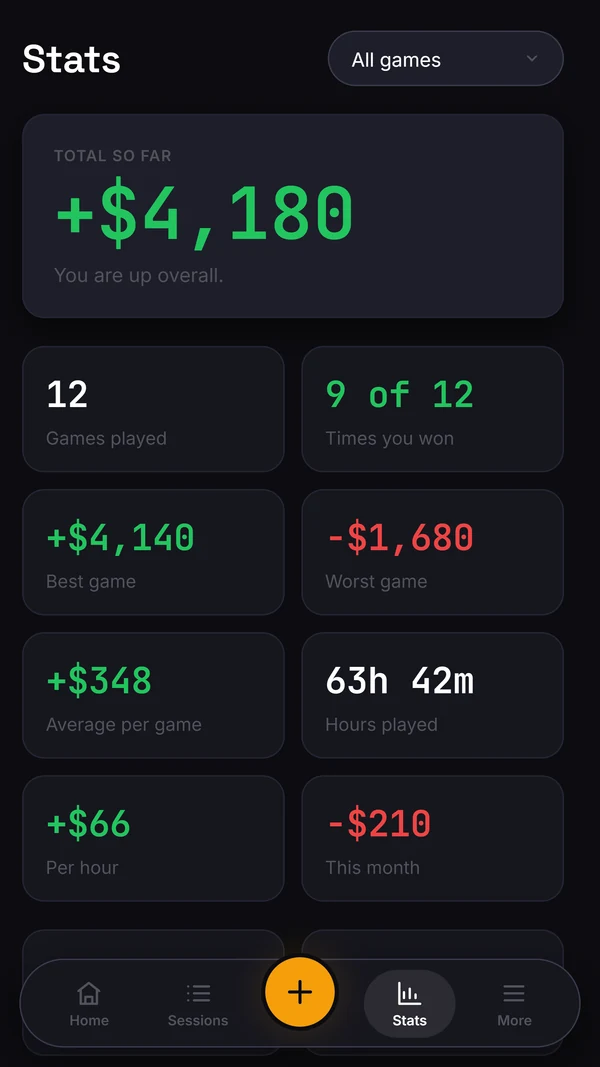
In the founder interview, Tom described using hourly rate and the results graph for his longer-term review while trying not to let one winning or losing session determine his next decision. He says downswings have affected his own play in the past. His practical response includes discussing particular hands with his coach and taking a break when he does not feel ready to play.
That is personal experience, not a diagnosis or a promise that a routine will produce winnings. Keep the financial record visible enough to respect your spending limits. A break does not create an obligation to return or recover a loss. Hand review asks what information was available at the decision; the graph reports what happened afterwards. Neither a short winning streak nor a losing streak proves an edge.
A drawdown scale is not a worst-case limit
For a positive-drift model, standard deviation squared divided by twice the win rate gives a characteristic drawdown scale. Inputs of 5 BB/100 and 90 BB per square root of a 100-hand block give 810 BB, or 8.1 buy-ins at 100 BB each. Halving the edge doubles that scale. It is not the expected worst downswing of a career, a maximum loss or a prediction of recovery.
Many players meet that stretch with no way to read it, then lose logging discipline mid-swing and start guessing. The rest of this page is the maths that replaces the guessing.
The same swing at different win rates
Hold the model's standard deviation at 90 BB per square root of a 100-hand block and vary only the positive win rate. The table compares the characteristic drawdown scale with the bankroll from a fixed-stake, infinite-horizon 5% risk-of-ruin model. The inputs are illustrative assumptions, not measured live-player norms.
The scale varies inversely with win rate: an input of 2 gives five times the scale of an input of 10 at unchanged volatility. The 5% bankroll is approximately three times this scale because minus the natural log of 0.05 is about 3. Neither relationship caps a real loss. A modelled positive edge may be wrong, and a fixed-stake model does not describe changing stakes or withdrawals.
A worked example: 400 hours, still normal
Take a genuine 5 BB/100 winner at 1/2 with a 90 BB/100 standard deviation, putting in 10,000 hands. At 25 hands an hour that is 400 hours of live play, roughly five months at 20 hours a week.
Step 1, expectation: 5 BB/100 x 10,000 hands = 500 BB expected win.
Step 2, spread: standard error = 90 x the square root of (10,000 / 100) = 90 x 10 = 900 BB.
Step 3, the 95% band: 500 plus or minus (1.96 x 900) = 500 plus or minus 1,764, so anywhere from -1,264 BB to +2,264 BB.
Under these fixed assumptions, a final result of -1,264 BB lies near the lower endpoint of the central 95% range. This is a range for the final result, not the maximum peak-to-trough loss during play. The calculation cannot establish that a real losing stretch has no leaks or that the player's edge remains unchanged.
Final-result ranges by sample size
In this hypothetical fixed-edge model, expectation grows linearly with hands while spread grows with the square root of hands. The lower endpoint first falls and then rises. Its minimum is around 31,100 hands for these inputs, not a worst-case bound on a player's graph. The model does not tell anyone how long to keep playing.
The assumed live pace converts hands to calendar time, but actual pace varies with the room and game. A central final-result interval does not measure the deepest drawdown along the way, and it does not diagnose a player's decisions. Use hand review, complete records and spending limits alongside any model.
The bankroll mechanics, then the emotional ones
The bankroll side is mechanical, so make it mechanical. Risk of ruin maths assumes you keep playing the same stake through the trough, and the number degrades fast as the roll thins: about 24 buy-ins puts a 5 BB/100 winner with a 90 BB/100 standard deviation at roughly 5% risk of ruin, but let the downswing take that to 15 buy-ins and the same formula says nearly 16%. Set the move-down trigger before the downswing starts, and let the risk of ruin calculator, not the mood of the session, decide where it sits.
The emotional side is where the real money leaks. A downswing degrades your A-game exactly when your margin is thinnest: sessions run longer chasing even, thin calls get talked into, and study stops because looking at the graph hurts. Shorten sessions, use a stop-loss as a tilt guard rather than a maths tool, and grade yourself on decisions per session, not on the result. The players who come out of downswings intact are the ones whose process never knew there was a downswing.
Riding variance or funding a leak
Riding variance and funding a leak feel identical from the inside. The graph points the same way. The difference only shows up in evidence, and there are two places to look.
First, the hands. Review your marked pots from the losing stretch and sort them honestly: coolers and standard spots that lost are variance; repeated patterns, calling too wide out of position, paying off rivers, bluffing into stations, are a leak with a price tag. Second, the sample. Run your full history through the win-rate confidence calculator: if the band around your measured win rate still crosses zero, you do not actually know you are a winner yet, and calling every losing stretch variance may just be an expensive way to avoid finding out.
Do not treat a suspected variance explanation as a reason to play more or recover a loss. Review particular decisions, costs, limits and readiness separately. Study can address a specific decision question, but it cannot guarantee winnings or require another session.
Set the rules before you need them
Write spending, time and review limits before play rather than negotiating them after a loss. No formula here supplies a worst-case loss or guarantees that a bankroll will recover. Taking a break or stopping is a valid outcome. Keep the record of sessions already played complete, and use specific hand review to examine decisions without treating the graph as a diagnosis.
Stop-loss rules for live cash
A stop-loss caps how much you will lose in a session before standing up. It exists to stop the tilt and fatigue leaks that follow a bad run, which usually cost more than the chips in front of you.
Set it in buy-ins
A fixed cash stop does not travel across stakes. Set the stop in buy-ins, for example two and a half buy-ins, so it scales with the game. The calculator turns that into the exact figure where you stand up.
Add a stop-clock
Losses are not the only leak. Decision quality degrades with hours, so cap session length the way you cap losses. A stop-clock protects the win rate that the late, tired hours quietly erode.
The rule beats the number
The exact threshold matters less than honouring it. A stop-loss you renegotiate at the table is not a stop-loss. Decide it before you sit, and treat standing up as the disciplined play, not the weak one.
Session-length leaks
Your A-game folds rivers correctly while stuck. Your C-game makes the call you would never make fresh. The expensive truth is how much of a long session is spent in the latter.
Fatigue is a measurable leak
Decision quality drops with hours, not only with tilt. Late in a long session the marginal spots tip the wrong way, a hero call here, a loose 3-bet defence there. Spread across enough sessions, that decline can cost more than any single technical mistake.

Find it in your own log
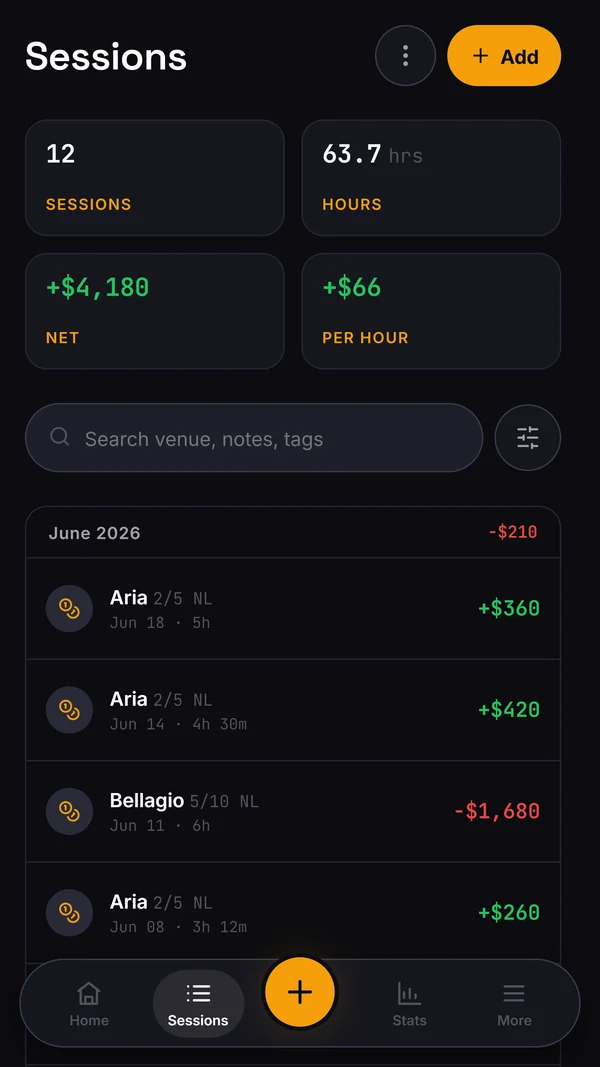
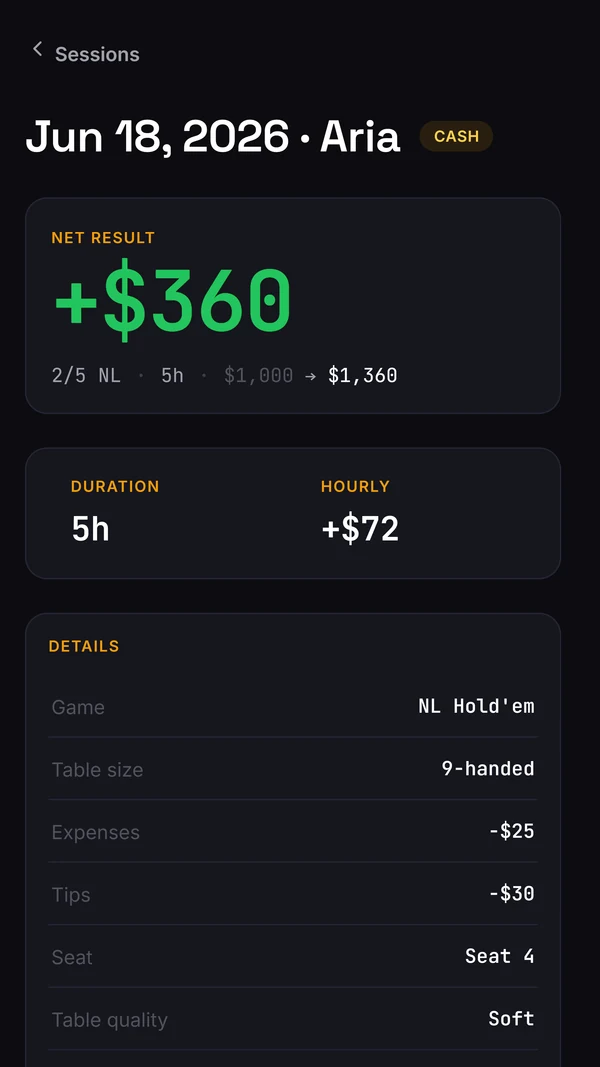
Split your results by session length and by time in seat. If your hourly sags in the back third of long sessions, you have measured your C-game. That is a pattern to act on, not a feeling to argue with.
Cap it with a stop-clock
Quit while still sharp. A pre-decided session length protects the win rate the late hours erode. The discipline is setting the clock before you sit, not negotiating with yourself at hour five.
The pre-session routine
Most players arrive at the table cold and spend the first hour warming up at full stakes. A short, repeatable routine gets you into your A-game before the money is live, not after.
Reach your A-game sooner
A few minutes reviewing a recent leak, recalling your plan against the regs you expect, and a quick readiness check turns the first hour from a warm-up into real play. The earlier you are sharp, the more of the session is profitable.
Check you should play at all
A warm-up is also a gate. Short sleep, a bad mood, or a thin roll for the only game running are all reasons to skip a session. Deciding that before you sit is far easier than deciding it while stuck.
Keep it short and repeatable
A routine only works if you actually do it, so keep it to a few minutes. The goal is consistency, a small ritual that reliably puts you in the right frame, not a long pre-game production.
- →A normal downswing can last far longer than intuition expects.
- →Stop-loss rules should protect decision quality and bankroll policy, not chase a daily result.
- →Readiness checks and session-length limits prevent variance from becoming a performance leak.